Low Frequency Seismology Monitoring
Why use SGs for low frequency seismology?
- Superconducting Gravimeters (SGs) have the lowest noise level at frequencies below 1 mHz
- Better than the STS-1 and much better than the gPhone
- Calibration by absolute gravity meters to better than 0.1 %; calibration stable to better than 0.01%
- At least one order of magnitude better than Global Seismographic Network (GSN) seismometers
- Investigation of elusive modes (2S1 firstly observed by SGs)
- Investigation of modes in both frequency and time domains
- Better determination of the frequencies and quality factors of individual singlets
- The potential of a sparse network of gravimeters for normal-mode research demonstrated by the International Deployment of Accelerometers(IDA)
- Provides standard in seismic laboratories
- Absolute calibration ensures traceability of seismic time series for reliable determination of magnitudes
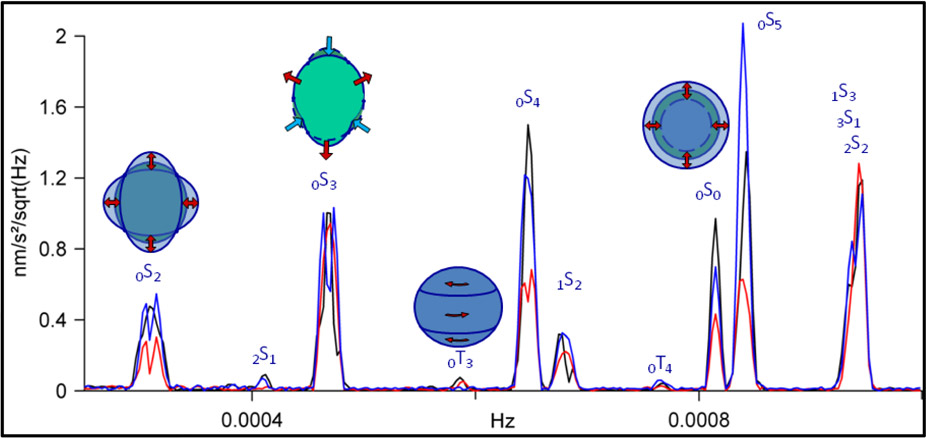
Figure 1: Spectra of normal modes below 1 mHz measured using a Superconducting Gravimeter (SG). Normal modes from 3 major earthquakes are compared: Blue - Japan (11 Mar. 2011, Mw=9.0), Red - Chile (27 Feb. 2010, Mw=8.8) and Black - Sumatra (26 Dec. 2004, Mw=9.3). Data sets are 60 hours long starting 4 hours after the onset of each event and was recorded by SG C021 at Membach, Belgium.
Current SGs are the lowest noise seismometers below 1 mHz
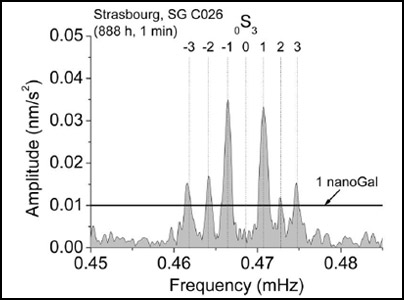 Figure 2: Observation of the well-resolved singlets of 0S3 using 888 h of data from SG C026 at Strasbourg, France after the 26 Dec. 2004, Mw = 9.3 Sumatra earthquake. The singlet m = 0 was not excited at Strasbourg (adapted from Rosat et al. 2005). The SG noise level on either side of 0S2 is well below 0.5 nanoGal.
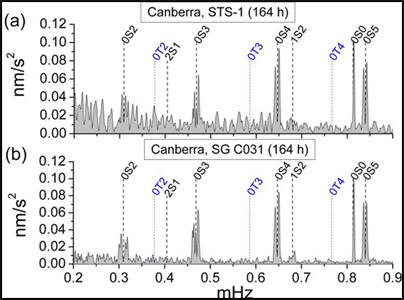 Figure 3: Comparison of SG C031 and STS-1 using 164 h of data after the 23 June 2001, Mw = 8.4 Peru earthquake recorded at the Canberra station. The upper spectrum (a) shows the data from a GEOSCOPE STS-1 seismometer and the lower spectrum (b) shows data from SG C031 single sphere instrument with a 5 gram sphere. Comparison of the two spectrum clearly shows that the SG has lower noise than the STS-1 in the long period seismic band below 1 mHz (Rosat et al., 2003a).
New Dual Sphere SG with a heavier sphere has even lower noise
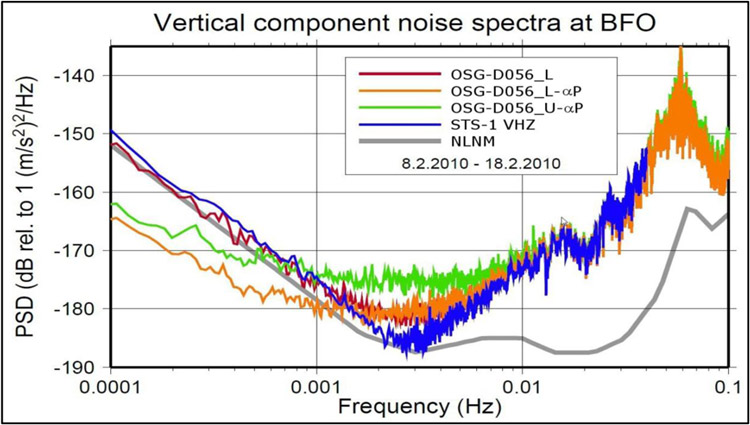
Figure 4: Noise power spectral densities of the upper and lower sensors of dual sphere Observatory SG (OSG-D056) and the STS-1 versus the Peterson (1993) new low noise model (NLNM) for 10 quiet days at the Black Forest Observatory (BFO), Germany. The upper sensor uses a 4.3 gram sphere, which is the usual mass used in most SGs, while the lower sensor uses a heavier 17.8 gram sphere. The green line shows the noise of the upper sensor (D056_U - αP) after removing atmospheric noise with an admittance of 3 nms-2/hPa. As is typically observed, the SG noise is reduced below the NLNM and STS-1 for frequencies lower than 1 mHz. The red and orange lines show data from the lower 17 gram sphere . The red line (D056_L) shows data before removing atmospheric noise, while the orange line (D056_L - αP) shows data after removing atmospheric noise. Before removing the atmosphere, the red line (D056_L) is in good agreement with NLNM and the STS-1 below 1 mHz. After removing the atmosphere, the noise from the 17 grams sphere (D056_L - αP) is well below the STS-1Z, NLNM and D056_U-αP. Figure courtesy of R. Widmer-Schnidrig, BFO.
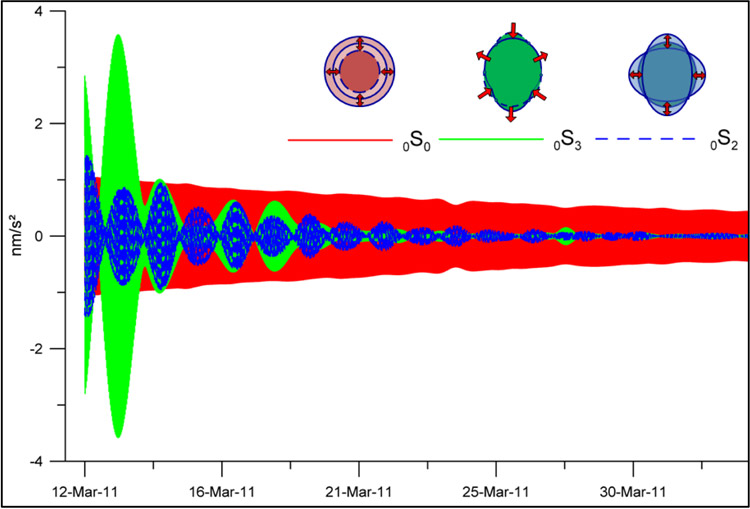
Figure 5: Time series from the Superconducting Gravimeter SG C021 at the Membach station, Belgium, after the 11 Mar. 2011, Mw = 9.0 Tohoku earthquake. Band-pass filters were applied to separate the modes 0S2 (period ~54 min), 0S3 (period ~35 min), and 0S0 (period ~20 min). Although 0S0 was less excited than the other modes by the earthquake, because of it’s small attenuation factor it eventually dominates the residual signal one week after the earthquake. It takes until early May for 0S0 to lose 90% of it’s amplitude. The 0S2 and 0S3 modes are much more attenuated than 0S0 and the slow beating is due to interference between the very close singlet frequencies within these two multiplets, as shown by Figure 1 on the cover page.
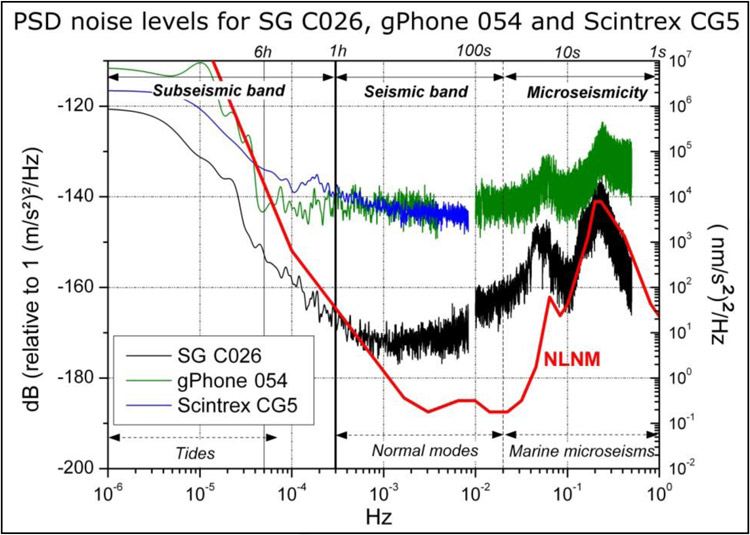
Figure 6: Power spectral densities for SG 026, gPhone 054 and Scintrex CG5 compared to NLNM for a 15 day record from Strasbourg, France. In the seismic band both the gPhone and CG5 are 20 dB noisier than SG-C026, or a factor of10 times noisier in amplitude (Riccardi et al., 2011). Neither the gPhone or CG5 are capable of detecting the small normal mode signals observed by the SG and STS-1 shown in Figures 2 and 3.
How is low frequency seismology used?
- Free oscillations (frequencies and decay rates) offer strong constraints on the Earth’s interior, composition, mineralogy and dynamics
- Below 1 mHz, normal modes are sensitive to 1D & 3D density structure
- Seismic hum (Earth’s background free oscillations)
- Moment of great and slow earthquakes
- Source mechanism of great earthquakes
- Fine structure of the spectra : multipletsplitting
- Attenuation(Q-1)
Observatory and iGrav® SGs provide
- Sub μGal precision
- Lowest noise below 1 mHz
- Calibration better than 0.1%
- Continuous time series
- No gaps and no steps
- Stable, flat transfer function
- Ultra low linear drift (∼μGal/year)
- Insensitive to local environment
- Tilt stabilized
Superconducting Gravity Meters Specifications
- Drift: Linear and < 5 μGal / year
- Precision: 0.2 μGal/Hz1/2 ⇔ 0.005 μGal @ 1000 s
- Calibration: Stable to a part in 104 for decades!
- Transfer function: Stable and flat in amplitude from DC to 100 s
- Lowest noise below 1 mHz: Lower than the best STS-1 seismometers
- Sampling:
- 1 Hz with GWR datalogger
- Quanterra Q330 compatible for higher sampling rates
- Performance: SG noise is 10 times lower than gPhone and CG5
download
![]() Low Frequency Seismology Monitoring (PDF - 1.06MB)
Low Frequency Seismology Monitoring (PDF - 1.06MB)


 Print This Page
